
Reports and exports
How much work came in, how much got done, how long it took, and where the hours went, with charts, a Gantt tab, CSV export and print.
On this page
The Reports page answers the questions people ask in meetings: Are we keeping up? What breaks most? How long do jobs take? It is for managers only.
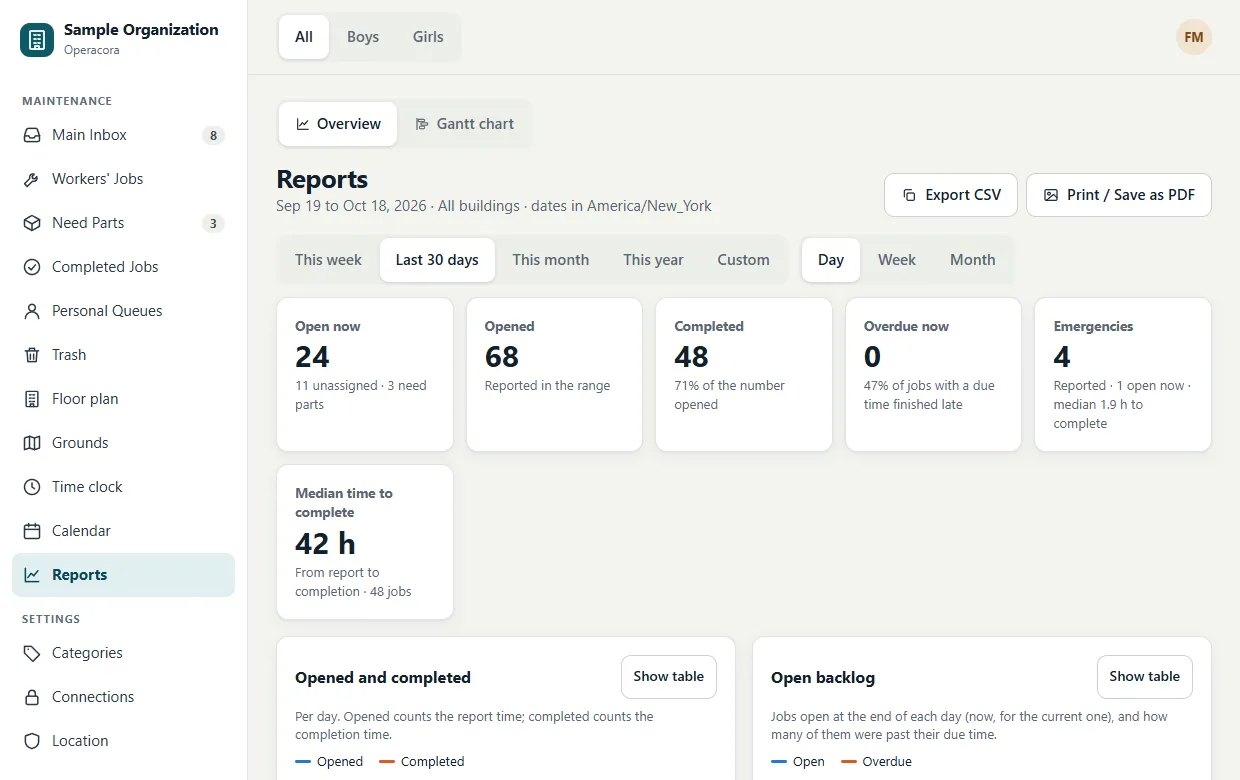
Choose the time and place#
- Pick This week, Last 30 days, This month, This year or Custom (up to a year).
- Group charts by Day, Week or Month.
- The building switch at the top filters everything.
Days are cut in your device's time zone, and the page says which one it used.
The numbers#
| Tile | What it counts |
|---|---|
| Open now | Jobs not finished yet, with how many are unassigned and how many need parts. |
| Opened | Jobs reported in the chosen dates. |
| Completed | Jobs finished in the chosen dates. |
| Overdue now | Open jobs past their due time, and how many jobs with a due time were finished late. |
| Emergencies | Emergencies reported, how many are still open, and their typical time to finish. |
| Median time to complete | The typical time from the first report to the final completion. |
The charts#
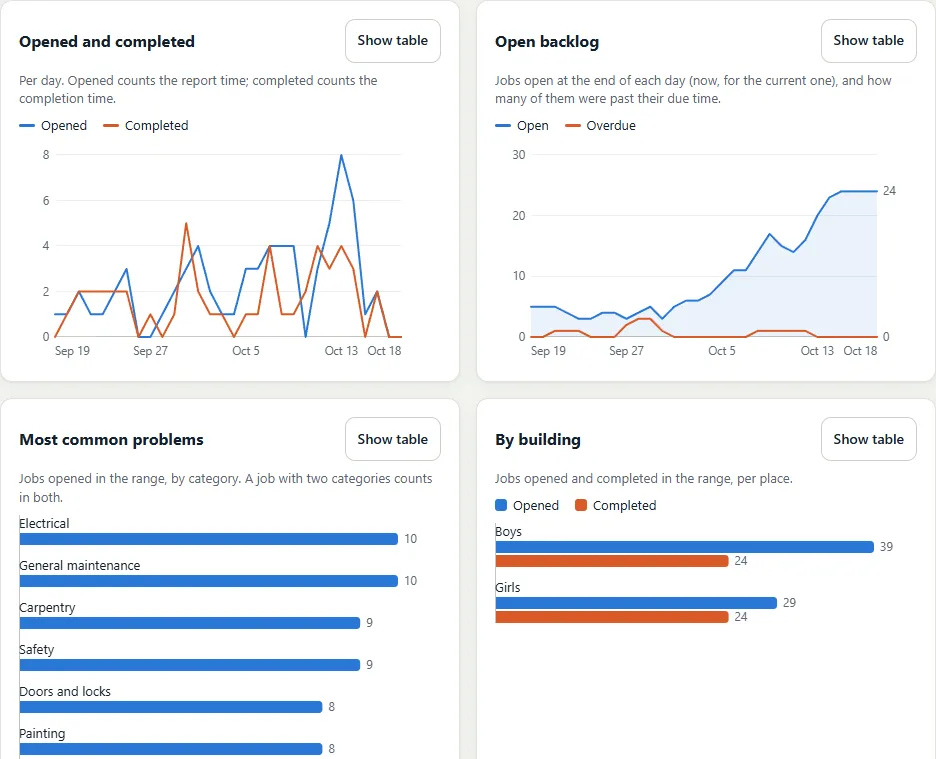
- Opened and completed over time.
- Open backlog, with how much of it was overdue.
- Most common problems, by category. A job with two categories counts in both.
- By building and by priority.
- Workload by worker: open now and completed.
- Time to complete: how many jobs took under 1 hour, 1 to 4 hours, up to over 30 days.
- Hours worked per person, from the time clock.
Hover over a chart (or focus it and use the arrow keys) to read exact values. Show table turns any chart into a plain table.
Gantt chart tab#
The Gantt chart tab shows planned work by start and end, with due times, for open jobs and work completed in the last 60 days. It works like the Gantt view.
Export and print#
- Export CSV downloads the numbers behind every section as a spreadsheet file. It contains counts and names, never the text of jobs.
- Print / Save as PDF opens your browser's print window with the controls hidden, so you can print the report or save it as a PDF for a meeting.
What the numbers include#
Reports count only jobs you can already open. A job in a peer's personal queue never changes your numbers, and nothing from another organization ever does. Hours come from your own shifts and those of people ranked below you. Jobs in Trash are left out.
Some measures need a full history of every change, which Operacora doesn't keep yet. These are listed under Not available yet instead of being guessed: time until a job is assigned, time spent waiting for parts, and priority changes over time.